Why S&P 500’s $6 trillion melt up rally exposes Bitcoin amid range-bound weakness
Traditional equities like the S&P 500 are staging a historic comeback, shaking off weeks of geopolitical anxiety to chart new all-time highs.
Yet Bitcoin, which has historically been a synchronized beneficiary of risk-on sentiment, is noticeably dragging its feet, leaving investors questioning what is missing from its narrative.
The S&P 500 closed higher by 0.8% this week, pushing the benchmark index to a record 7,022.95 and eclipsing its previous peak established in late January.
The milestone marks a dramatic reversal from the turbulent first quarter, where the index plummeted nearly 10% to a local bottom of 6,316.91 on March 30 amid the US-Israel-Iran conflict and subsequent oil price shocks.
While Wall Street celebrates a return to “greed” and heavily capitalized tech stocks reclaim their market dominance, Bitcoin remains ensnared in a prolonged consolidation phase.
The flagship cryptocurrency continues to trade significantly below its previous all-time high, highlighting a rare and persistent decoupling from traditional risk assets that has not been observed with this severity since 2020.
The ‘momentum thrust’ fueling equities
The velocity of the stock market’s recovery has caught many institutional desks off guard.
In the two weeks since the late-March lows, markets have rapidly adjusted to the sustained geopolitical uncertainty in the Middle East and added over $6 trillion in market capitalization.
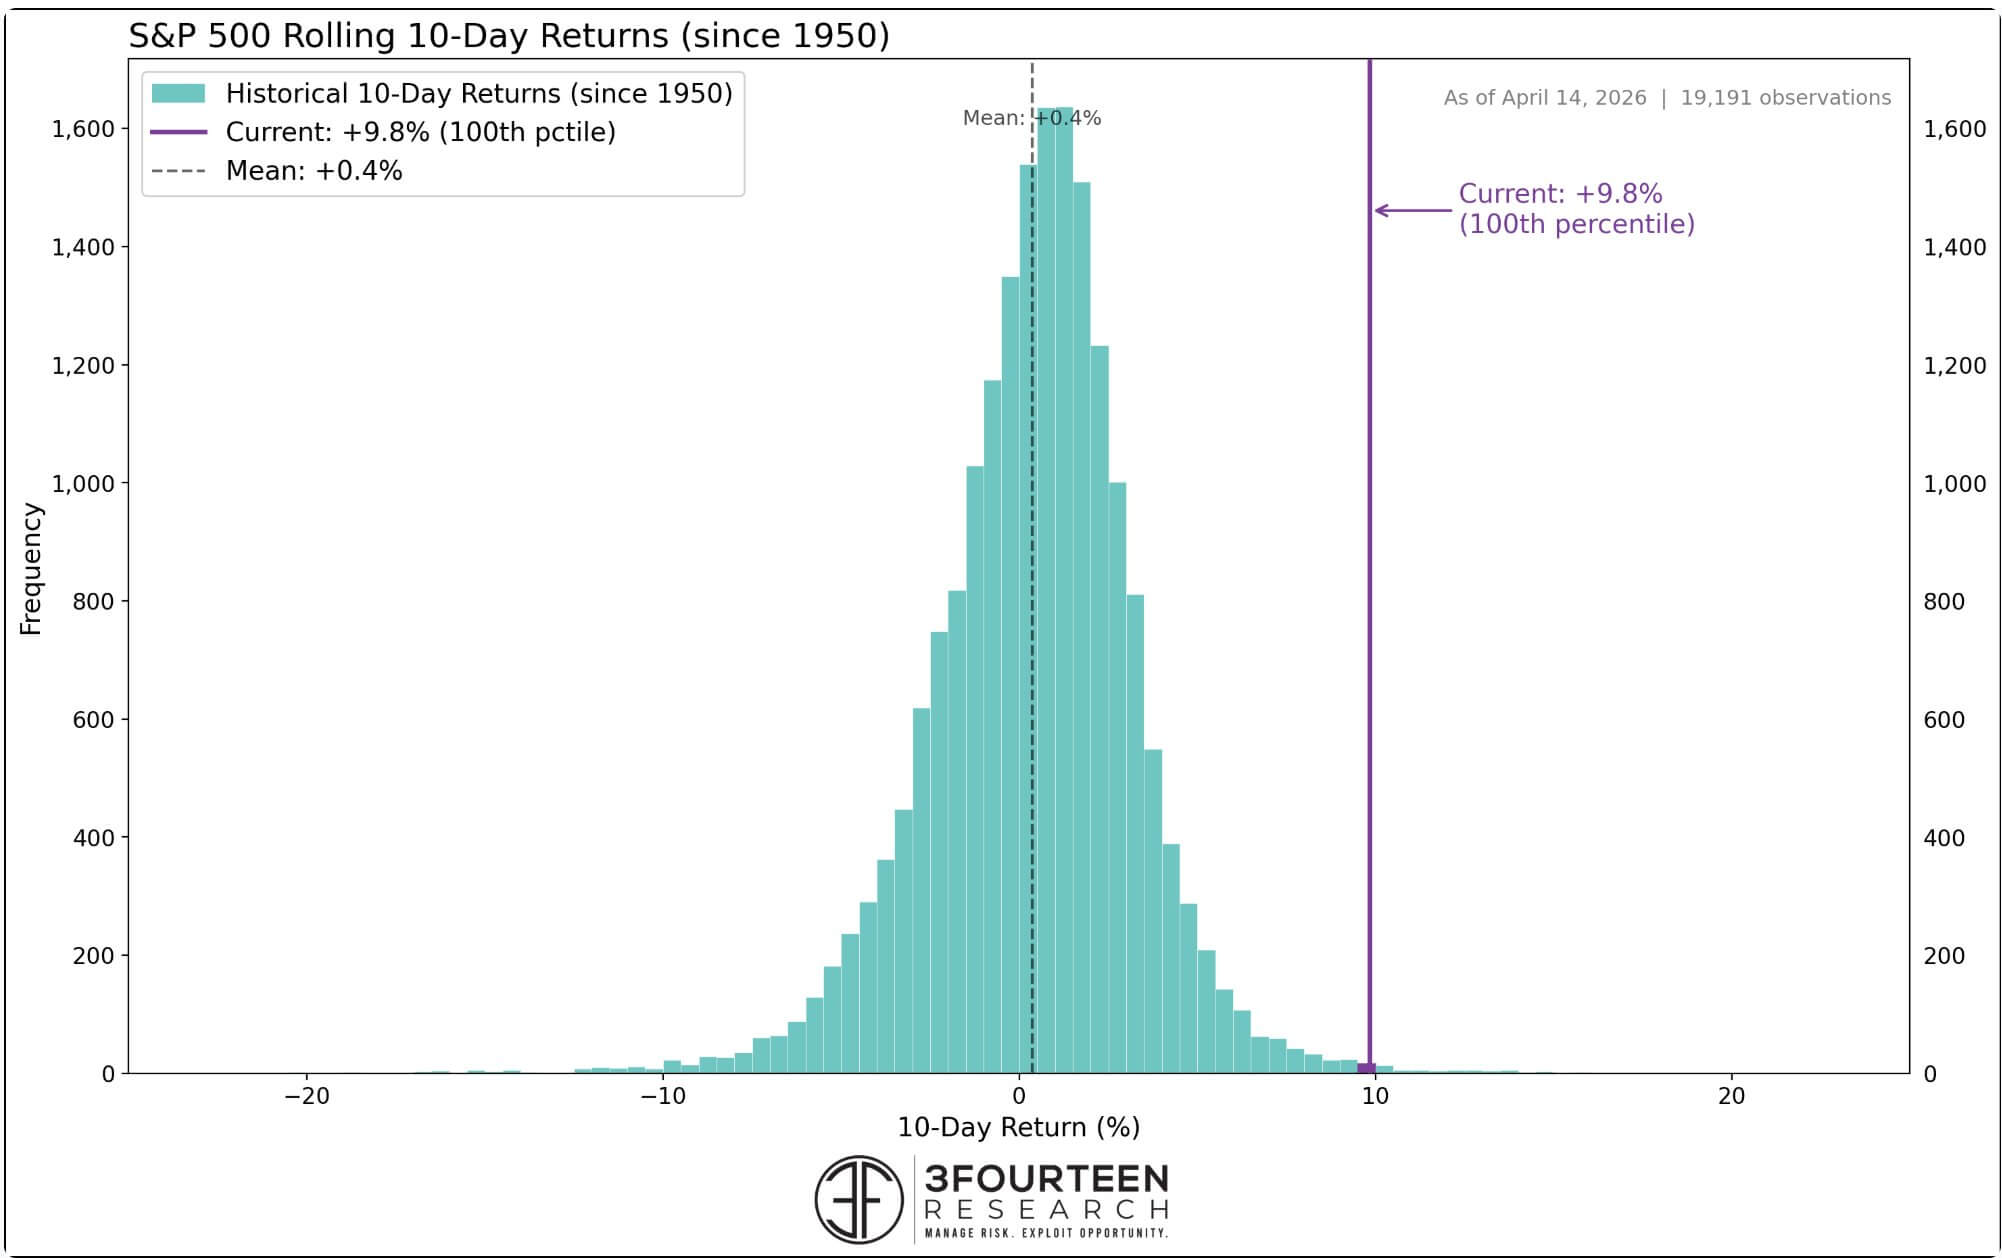
According to Warren Pies, founder of 3F Research, the market’s trajectory over the last ten days represents a statistical anomaly. The S&P 500’s near 10% surge places it in the 99.7th percentile of all 10-day returns.
Historically, there have been only 20 instances since 1950 where the stock market has recorded such aggressive short-term gains. Pies characterized these events as bullish “momentum thrusts,” which typically yield an average return of 19% over the next twelve months.
However, what makes the current equity rally unique is its proximity to all-time highs.
According to Pies, the previous momentum thrusts almost exclusively occurred during deep bear markets, with indices still languishing 20% or more below their peaks.
Meanwhile, the current market recovery has been distinctly top-heavy. Since the March 30 low, a fund tracking the “Magnificent 7” mega-cap technology stocks has surged nearly 18%, outpacing the broader S&P 500 by roughly 8% when excluding those seven companies.
This aggressive institutional buying is largely driven by the “AI-Infrastructure” narrative, with sector leaders like Oracle serving as the primary engines of global productivity growth.
Moreover, the macroeconomic backdrop has also provided a robust tailwind.
Easing tensions in the Persian Gulf, highlighted by diplomatic talks and a temporary ceasefire, has alleviated immediate fears of a prolonged blockade in the Strait of Hormuz.
At the same time, the US Producer Price Index (PPI) data for March came in well below expectations at 0.1%, showing that the US economy remains highly resilient and largely insulated from the temporary energy-driven inflation spikes that capped market gains earlier in the year.
A historic decoupling for the crypto market
While the Nasdaq Composite simultaneously celebrated a 10-day winning streak, its longest since late 2021, the digital asset sector has failed to mirror this unbridled optimism.
Despite the easing macroeconomic pressures, Bitcoin remains heavily discounted, hovering around the $74,000 to $76,000 range.
This represents a staggering 40% drawdown from its previous all-time high of more than $126,000, reflecting the sluggishness that has persisted for several months.
Data compiled by CryptoQuant highlights this divergence. According to the firm, Bitcoin has traditionally operated as a high-beta asset that loosely follows the liquidity trends of the S&P 500 and Nasdaq.
However, its current price performance is being driven by its own internal sluggish dynamics. As a result, the current period of weak correlation with the S&P 500 is now the longest stretch observed in over four years.
This is also evident in the fact that the sentiment across the digital asset space has transitioned into a “complacency phase.”
According to analytics firm Alphractal, broader crypto market sentiment sits at a neutral, borderline bullish level, which is highly unusual given the asset’s significant distance from price discovery.
On-chain metrics signal a fragile recovery
Underneath the hood, on-chain data reveals exactly why Bitcoin is struggling to break out: a severe lack of sustained capital inflow.
Alex Adler, an analyst at CryptoQuant, pointed to the 30-day Realized Cap change, a metric that tracks net capital inflow into the Bitcoin network.
Since mid-January, the metric has been flashing warning signs. Out of the first 105 days of 2026, only seven recorded a positive 30-day Realized Cap change. Since January 23, capital has been systematically leaving the network, culminating in an extreme localized outflow in late February.
Adler noted:
“Since mid-January, capital has been systematically leaving the network without meeting compensating demand.”
While the outflow pressure has slowed in recent weeks, improving to -0.32% from steeper deficits earlier in the month, a true macroeconomic reversal has not yet occurred.
For Bitcoin to mount a credible attack on its all-time highs, Adler argues that the Realized Cap must transition into sustained positive territory for several weeks, accompanied by price appreciation above key short-term holder cost bases.
There are, however, preliminary signs of structural repair. Bitcoin is currently testing its Adjusted Realized Price, which sits at roughly $72,300. This metric represents the average break-even level for a massive cohort of active investors.
Reclaiming and holding this cost basis is traditionally a prerequisite for a sustained bullish trend, serving as a critical psychological support level that encourages investors to hold rather than capitulate during pullbacks.
Institutional positioning and the path forward
Despite the lack of a definitive breakout, institutional footprint in the crypto market remains highly visible.
Rachel Lucas, a crypto analyst at BTC Markets, highlighted that Bitcoin’s recent push toward a 70-day high of $76,000 was heavily subsidized by $411.5 million in daily spot ETF inflows, the second-largest single-day figure recorded in April.
Furthermore, options markets are reflecting a subtle shift in risk appetite. According to Block Scholes, the strong skew towards put contracts (downside protection) in Bitcoin options markets has begun to ease following the de-escalation in the Middle East.
Yet, this easing of downside fear has not directly translated into aggressive spot buying.
Glassnode data indicates that while spot and ETF demand are improving, the market is characterized by quick profit-taking and cautious options positioning.
According to the firm, the current recovery is highly “twitchy” and flow-driven, lacking the deep-seated conviction seen in traditional equities.
Considering this, market-structure analysts at Bitunix told CryptoSlate that Bitcoin is currently serving as a real-time test of the market due to its capacity to absorb risk.
The asset faces a formidable supply zone and clear resistance around $75,500, with a dense cluster of leveraged liquidations stacked just above $76,000.
For now, the $70,000 level remains the critical support floor that institutional buyers are actively defending.
If Bitcoin can convincingly clear the $76,000 resistance, it could trigger a cascading short squeeze, forcefully ending the asset’s historic decoupling and realigning it with the broader, record-setting Wall Street supercycle.
Lucas explained:
“A sustained break above US$76,000 would represent a meaningful structural shift and open the path toward the $80,000 handle.”
Until then, the crypto market remains in a tense holding pattern, waiting for the capital inflows required to validate a new bull phase.
The post Why S&P 500’s $6 trillion melt up rally exposes Bitcoin amid range-bound weakness appeared first on CryptoSlate.